


Common final cumulative exam in anatomy and physiology: A decade of summative assessment reveals most challenging concepts and prompts various interventions
By: Abass Abdullahi
Dept. of Biological Sciences
Bronx Community College of the City University of New York
Abstract
A decade long study was conducted on the assessment of 25 cumulative common final multiple-choice questions at the end of every semester from Spring 2008 to 2018 for both courses in the two semester Anatomy and Physiology (A&P) curriculum. The assessment design heavily involved faculty from the beginning; faculty were asked to contribute to the question pools on which the finals were based. There were slight modifications over time based on feedback from the previous semester’s assessment data, but generally the same concepts were maintained for consistency. Overall, the study revealed that A&P I students averaged 67% when all 25 questions were combined and approached the 70% benchmark that was set as a marker for student success in 17 out of the 25 concepts. This was not the case for A&P II, where the overall average was 62%, and individually students were closer to the benchmark in only 13 concepts. For both courses, we identified the 7 most difficult concepts that need better pedagogical approaches. Some of these concepts were consistently performed at or below 50%, even at their most basic difficulty level, and may thus be considered as concepts that most students couldn’t grasp at all. These later concepts included cellular metabolism, action potential and QL-protein synthesis (A&P I), as well as blood osmolarity, acid base and reproductive questions (A&P II). The information revealed by the current study is very useful in curricular redesign and challenges faculty to think of the best innovative strategies to improve student outcomes.
Introduction
Anatomy and Physiology (A&P) has notoriously become a stumbling block for students interested in pursuing allied health majors, which often attract many students due to job availability and relatively generous remuneration (McKee 2002; Sturges, Maurer, Allen, Gatch, & Shankar 2016). This popular allied health career choice, among others, may be one of the reasons why our institution, Bronx Community College (BCC) of the City University of New York (CUNY), was recently recognized as one of the colleges with the highest mobility rates, a measure of helping individuals move from low to relatively higher income households (Chronicle of Higher Ed, 2017). Many A&P students were observed to be driven by such extrinsic motivation, mostly taking the course for expected future rewards (Sturges et al. 2016), although intrinsic motivation has been better correlated with good performance and deeper understanding of course content (Kusurkar, Croiset & Ten Cate 2011). At our institution, like most other places, the two semester A&P sequence is required for nursing and allied health courses like radiology technology, therapeutic recreation, community health, dietetics and nutrition, et cetera, with most students declaring nursing as their major (Abdullahi 2011). These allied health programs usually require a good performance in A&P and other prerequisites that are good indicators of successful completion of allied health licensing exams like those in the nursing program (Dean & Fischer, 1992; Neuman, 1991). However, students who successfully complete these programs are in the minority, with A&P often ending student dreams and aspirations.
Due to the limited science and biology backgrounds of most students attempting the A&P sequence, the course is often regarded as highly demanding, with only a small percentage of students able to meet the required standards (Hull, Wilson, Hopp, Schaefer & Jackson 2006; Harris, Hannun & Gupta, 2004; McKee 2002). Add to the mix English language challenges for Hispanic serving institutions, like ours, thus making it even harder for second language learners to master basic scientific vocabulary. In addition, many students, especially at the community college level, have a myriad of socio-economic challenges that further compound their limited backgrounds (Harris, Hannun & Gupta, 2004). Many students at our institution are also full-time working-class individuals who are trying to improve their future working conditions by enrolling in allied health majors, but before getting there they have to juggle between demanding working hours and course time (Abdullahi & Gannon 2015). Student working hours in paid employment and the number of concurrent courses taken within a semester have been negatively correlated with performance in A&P (Harris, Hannun & Gupta, 2004). Some of these non-traditional students may not have proper resources for getting textbooks, and their housing conditions also may not be ideal. This results in poor study habits, lack of confidence, and, ultimately, poor student outcomes.
While it’s too much to expect a two-semester A&P course sequence to remedy decades-long educational deficiencies, faculty should make efforts to give a quick overview of basic concepts before delving into more complex and detailed concepts as much as possible. At the same time, the right balance between content versus outcome needs to be established regarding how much to cover within the course vis a vis how much should students be expected to know by the time they complete the course. Within this context, it’s important to know that higher order skills can best be gained after mastery of the relevant knowledge base, with gradual build up through a taxonomy scale (Bloom 1974). Retention of concepts for long term knowledge is also improved by having initial testing followed by tests on the same concepts later in the semester (Szpunar, McDermott, & Roediger III 2007). In fact, even the expectation of a test, whether or not students eventually do the test, is enough to potentially boost performance. Apparently, this is because how students approach the study material depends on whether they think they need it later or can “delete” it as soon as initial testing is done (Szpunar, McDermott, & Roediger III 2007). The advantage of having to review material later after a gap between testing, referred to as the “spacing effect,” also helps with long term memory.
It’s perhaps for this reason that typically a lot of colleges have A&P exams (and other courses too) throughout the semester followed by an end of semester summative assessment, usually in the form of a cumulative exam. In our case, the cumulative final exam not only encompasses material covered throughout the course, but also part of it is common to all sections taking the course that semester. Like most other colleges, it also mainly targets the two lower skill levels of knowledge and comprehension, with only a small proportion testing the higher levels of Bloom’s taxonomy. This is especially for the first course in the sequence (A&P I), with relatively more advanced skills incorporated in A&P II. However, given the weak student backgrounds, a number of faculty argue that what may be considered lower level skills on Bloom’s taxonomy may actually be more advanced in the A&P context for students that have to apply new concepts into a weak second language knowledge base. In fact, this isn’t unique to our students because even though about three quarters of the Human Anatomy and Physiology Society (HAPS) cumulative exam is on the first two levels of Bloom’s taxonomy, with the first level accounting for about half of the test (HAPS exam 2015), the national average is in the low 50’s%. This means that there are certain concepts that students struggle with even in their most basic form. It’s important to know whether student struggles with these concepts in the A&P curriculum are random or if there are specific concepts within the sequence that they always find challenging, and the best way to do this could be through a long-term study. More importantly, once some of those concepts have been identified, we need to have potential interventions that may be introduced to remedy the situation.
In order to better understand our student needs and inform curricular changes, a decade long A&P assessment study that mainly tests student knowledge and understanding of essential topics in A&P I (BIO 23) and A&P II (BIO 24) was initiated at BCC in Spring 2008 through 2018. The assessment consists of 25 common multiple-choice questions given to all A&P sections as part of final exams. The common questions were carefully chosen from question pools provided by faculty, to incorporate at least one or two major concept(s) from each of the topics covered in each course. The main objectives of the study were to:
- Follow the overall performance of A&P I and II students annually relative to the set 70% student success benchmark
- Follow the individual performance of A&P I and II students in the 25 questions relative to the set 70% student success benchmark
- Identify the most difficult A&P concepts, including those that most students couldn’t grasp (below 50%).
Here, data is presented from this study identifying the most difficult concepts for the students, and their performance relative to the benchmark. Potential interventions to help improve student outcomes are also discussed.
Methods
Designing and Administering the Comprehensive Common Final Exam
In order to get as much faculty buy-in as possible, all faculty in the Biological sciences department were asked to contribute to a “huge” test bank within a given timeline (Sujitparapitaya 2014). A&P course coordinators were then tasked with the selection of the most appropriate questions from the faculty pool generated earlier. Faculty were then given another chance to rank the coordinators’ choices. Coordinators then narrowed down to 25 common final exam questions in A&P I and II. The questions were sent to faculty about a month ahead of the finals week every semester, with clear instructions on the semester’s common final questions, finals schedule, data collection excel sheet, submission deadlines and contact person(s) in case they needed help with anything, as described in Table 1. Faculty then shared their results with coordinators before the beginning of the next iteration of the course. Initially, this communication was mainly through email, but later there was a switch to a google doc data collection strategy. Results from previous semesters were regularly discussed at course and departmental meetings and attempts made to edit some questions, with the goal of generally keeping questions within a similar proficiency level whilst clarifying any confusing parts.
Table 1: Sample email sent for assessment collection and the appropriate rationale for the various strategies employed.
| Theme | Description | Rationale |
| A&P 25 common questions sent a month in advance | Please find the following attachments to this mail: File containing 25 multiple-choice common questions (BIO 23) to include in your exam. The file includes an addendum with a list of concepts. For your reference, those in red in the addendum are not included in the common questions. | Allow faculty ample time to see relevant concepts tested and perhaps help in review sessions as well. |
| A&P 50 instructor-specific questions included | Faculty need to add 50 multiple-choice questions of their own to the 25 common questions in order to complete a total of 75 questions. | This way all students will have the same amount of time to answer the 25 common questions and faculty have leeway to include their preferred questions. |
| A&P spreadsheet | Spreadsheet to submit the outcome of the 25 common questions. You need to copy the output from the scantron item analysis sheet (# wrong answers). Please ask the coordinators or any of your colleagues if you have any questions about using the scantron analysis sheet. | Allow for consistent results submission and make it easier for faculty to input data straight from the scantron analysis item. |
| A&P final exam schedule | Also included is the final exam schedule, with a link provided to the relevant college site. | Allow faculty to plan accordingly. |
| A&P coordinators contact person | You need to submit the attached spreadsheet to xxxxx@bcc.cuny.edu before the end of June for Spring classes (Dec for Fall classes). We later changed during the last three years of the study to google doc data entry format | Give faculty a contact reference for communication and a deadline. |
Data Analysis and Statistics
Descriptive statistics like means and standard deviation were analyzed for the concepts tested and the best line of fit was also included to virtually observe individual deviations from the set benchmark. We set student success benchmark at 70%. Pearson correlation statistics were also used to look for any data correlation between the years of study and concepts tested.
Results
Overall Performance Over the 25 Questions Shows A&P I Approaching Benchmark; Better Than A&P II
Overall, the performance for A&P I over the 25 common final questions was at 67%, nearing our benchmark of 70%, whereas performance for A&P II was lower at 62%, as illustrated by the dotted linear trend lines in Figure 1 below. The overall performance over the years show near consistent performance for both A&P I and A&P II, with the dotted linear trend lines almost flat (Figure 1). The performance was the lowest for both A&P I and A&P II at the beginning (Year 1; 2008/9 academic year) at 60% and 51% respectively, with the most improvement the following academic year (Year 2; 2009/10) to 71% and 68% respectively. Since then, performance for A&P I has been nearly identical, hovering at mid to high 60’s, with the best performance at 69% in Year 7 (2014/15 academic year), before a slightly downhill trend the following three years, with the last year of study (Year 10; 2017/18) at a low 64%.
Similar trends were observed for A&P II, where a slight bump at the beginning (Year 1 to 2; 2008/9 to 2009/10) was followed by near identical performances in the low 60’s the following years (Figure 1). The best performances were observed at 67% and 66% in Year 6 and 7 respectively (2013/14 and 2014/15), before another downhill trend the next three years, culminating at a low performance of 59% at the end of the decade long study in 2017/18 (Year 10). Incidentally, this slight downhill trend that is similar in both A&Ps coincided with our change of data collection method from email/hard copy based approach to google doc online anonymous data entry, where we may have had a slight change in the type of faculty (tech savvy vs hard copy type etc.), even though we as coordinators still offered to help anyone with data entry challenges. The trends were so similar over the years that Pearson correlation data analysis showed a very strong correlation coefficient at around 80% for both data sets. This means given the data from the first few years, we could predict the rest of the data with close to 80% accuracy. In the beginning the prediction accuracy was in the 70’s%, but as more data was generated over the years, the linear regression prediction accuracy improved to 80’s%.

Figure 1: Decade long annual performance average for A&P I (BIO 23, n=4153) and II (BIO 24, n=2674) for 25 common final questions as a whole, starting from 2008/9 (Year 1) to 2017/18 (Year 10) academic years.
Seventeen of 25 Questions Reaching or Approaching 70% Benchmark in A&P I, But Only 13 for A&P II
As shown by Figure 2 below, A&P I had more satisfactory performance with more students reaching or approaching our benchmark of 70% in about 17 out of the 25 questions, representing 68% of the questions tested. It was impressive to see that of these numbers; a significant number of students were able to reach the benchmark (or be extremely close to it) in about half of the questions tested. The concepts tested in these test questions are summarized in Table 2 below and may be used in combination with this figure to better understand the trends. As Figure 2 shows, A&P I performance results for the first 7 questions testing knowledge and understanding of basic chemistry, hierarchy and organization, negative feedback, pH, macromolecules and organelles, were all within the 70% benchmark or very close to it; certainly, it was very close to the linear dotted trend line. Additionally, active transport and osmosis (Qs 9 and 10), skeletal system and neuromuscular junction (Qs 14-16), as well as spinal cord and brain lobe functions (Qs 21-22), all performed relatively well.

Figure 2: Decade long overall performance average for each of the 25 common final questions for both A&P I (BIO 23, n=4153) and II (BIO 24, n=2674).
However, the performances of A&P II (BIO 24), as shown in Figure 2, are more like a negative feedback type up and down wave, with good performance in one topic/concept followed by a bad performance in the next set of questions. The result is that little student performance data falls on or near the linear dotted trend line, with student’s performance at or near the 70% benchmark in only 13 out of 25 tested questions, representing slightly over half at about 52%. Still, there was satisfactory performance on heart structure/function (Q1), EKG waves (Qs 3-4), blood pressure graph and blood doping (Qs 6 & 8), as well as immune and lymphatic systems (Qs10, 11 & 12). There was also performance near the benchmark for some of the latter questions covering urinary and digestive systems (Qs 18-22).
Table 2: The A&P I and II concepts tested for each of the 25 common questions. Green color code means average concept performance is at the 70% benchmark or very close to it (included up to 60%); yellow means performance is significantly below the benchmark but above 50% and red means it’s at or below 50% on average.
| Question | BIO 23 (A&P I) Topic/concept | BIO 23 (A&P II) Topic/concept |
| 1 | Levels of organization/hierarchy | Heart structure/function: Myocardial thickness |
| 2 | Negative feedback | Cardiac output: sympathetic vs parasympathetic impulses |
| 3 | Basic Chemistry/energy shells | EKG waves as it relates to SA/AV nodes |
| 4 | pH and H+ ion concentration | EKG waves and depolarization/repolarization |
| 5 | Decomposition and synthesis reaction examples | Nervous system and blood flow |
| 6 | Macromolecules; basic understanding of biological molecules | Blood pressure: graph interpretation and blood vessels |
| 7 | Organelles and basic functions | RBC structure/function |
| 8 | ATP production; Aerobic/Anaerobic respiration | Blood doping and viscosity/pressure |
| 9 | Active transport | Blood osmolarity and volume |
| 10 | Osmosis; basic understanding of tonicity | T and B lymphocyte functions |
| 11 | Genetics: Basic transcription products | Vaccination and immunity |
| 12 | Genetics: replication/transcription examples; application | Lymphatic system functions |
| 13 | Quantitative literacy (QL): Protein synthesis | Gas exchange; diaphragm; volume and pressure relationships |
| 14 | Skeletal system: calcium homeostasis | Chemoreceptors; acid base balance and O2/CO2 blood concentrations |
| 15 | Skeletal system: calcium homeostasis; cells | Oxygen partial pressure; blood vessels and diffusion |
| 16 | Neuromuscular junction | Glomerulus filtration and urine content |
| 17 | Sarcomeres and sliding filament theory | Kidneys role in acid base balance |
| 18 | Isometric and isotonic contraction | Kidney function and hormones |
| 19 | Action potential: Speed | Chemical and mechanical digestion; macromolecules |
| 20 | Action potential: ion channels and graph interpretation | Role of stomach/intestines etc. in digestion |
| 21 | Spinal cord functions | Role of accessory glands in digestion; macromolecules |
| 22 | Brain lobe functions | Digestion and hormones |
| 23 | Endocrine system: Hormone targets | Male and female reproductive hormones: corpus luteum etc. |
| 24 | Endocrine system: Hormone action | Male reproductive hormones: testosterone |
| 25 | Endocrine system: Hormone receptors | Female reproductive hormones: Fertilization and implantation |
Students Struggling With ATP Production, Action Potential and QL Protein Synthesis Among Other Difficult Concepts in A&P I
As seen in Figure 2 above, the first readily noticeable huge drop in A&P I student performance for the 25 common questions tested was ATP production (question 8; see Table 2 as well) at an average performance of 43%, a massive 27% below our stated 70% benchmark! Similarly, another big drop was for genetics application concepts on transcription and quantitative literacy/protein synthesis (Qs 12 and 13), at 53% and 48%, respectively. The other difficult concepts that students struggled the most with were action potential (Q19 at 47% overall performance), muscle physiology and muscle tension (Q17 & 18 at 58% and 52% respectively) and endocrine hormonal targets (Q23 at 45%). These most difficult concepts for A&P I students to grasp have been covered in more detail in Figure 3 and Table 3 below.
Figure 3 below shows that 3 of these 7 most difficult concepts are interesting in that their performance has averaged under 50% over the course of the study, with some never going over that mark at any time during the study period. ATP production is one of those concepts, and it continues to have the worst performance over the last decade, no matter how we modified the questions over the semesters. It just seems to be a concept that students struggle with; we should therefore use our assessment data to guide us to look for better pedagogical ways of teaching this difficult concept.
The other concepts in this category were action potential and QL-protein synthesis type questions. The latter concept involved using basic quantitative literacy approaches to solve protein synthesis type questions that require students to know and apply the relationship between codons and the triplet rules for amino acid formation. Students also struggled with concepts relating to the role of myelination and axon size on conduction speed (Q19), as well as interpretation of polarization graph as it relates to voltage and ligand gated ion channels (Q20). A&P I students also had difficulty applying basic complimentary base pairing type questions for DNA replication or RNA transcription (Q12).
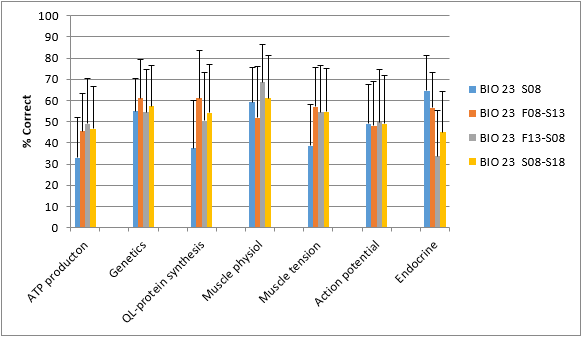
Fig 3: Most difficult BIO 23 (A&P I) concepts based on common exam analysis. The data shows comparison of the starting point at Spring 2008, the first and last five years, plus overall decade long averages along with standard deviation between sections (n=4153).
As shown in Figure 4 below, the performance for ATP production and action potential was nearly flat and almost always hovering in the high 40s or sometimes in the 50s, but never close to the 70% benchmark. This figure complements Figure 3 above that only gave multi-year summaries (5-10 years), but it also shows another interesting phenomenon.
Although Figure 3 above shows the overall performance on muscle physiology and endocrine target questions were below the 70% benchmark, this is only part of the story. A closer look at Figure 3 may show the keen observer that as this average performance for muscle physiology questions improved during the last five years, albeit not enough to alter the overall decade long performance over the benchmark, the performance for endocrine target questions went in reverse order. This is much more obvious in Figure 4, where annual data analysis shows a mirror image of the two data sets and the exact time when this reverse role in fortunes happened, around midway through the study. Interestingly, around this time, there was a switch of recommended syllabus coverage, where muscle physiology was moved from the end of the semester schedule to earlier in the semester and the endocrine system was put in its place.
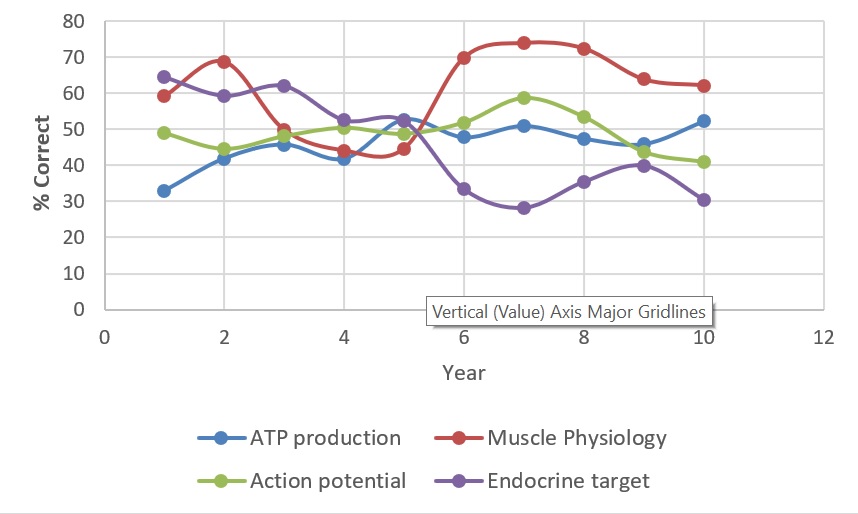
Figure 4: Student performance on 4 topics considered difficult concepts showing there may be differences due to truly difficult nature of topic (flat line; ATP production and Action potential) and/or timing of the syllabus (Muscle physiology and Endocrine target). The study commenced in 2008/9 (Year 1) to 2017/18 (Year 10) academic year (n=4153).
Table 3: Sample questions of the most difficult concepts in A&P I and II to help with awareness for potential emphasis during review sessions. Yellow color code means performance is significantly below the benchmark but above 50% and red means it’s at or below 50% on average. Note that the sample questions for the 7 most difficult concepts selected for each course were considered to be the most representative of the least performed concepts.
| A&P I Topic | Sample A&P I Question | A&P II
Topic |
Sample A&P II Question |
| ATP production; Aerobic/Anaerobic respiration | Which of these processes is a common step that happens before both aerobic respiration and anaerobic fermentation?
a. citric acid (Krebs) cycle b. glycolysis c. electron transport chain d. all of the above |
Heart; Cardiac output: sympathetic vs parasympathetic impulses | If stroke volume decreases due to blood loss, homeostatic mechanisms will attempt to bring cardiac output back to normal by:
a. decreasing the heart rate b. increasing sympathetic impulses to the heart c. increasing parasympathetic impulses to the heart d. all of the above |
| Genetics: replication/transcription examples; application | Given the sequence of the DNA template as GTCATG, what would be the sequence of the mRNA?
a. CAGTAC b. CUGTUC c. CAGUAC d. GUCAUG |
Blood flow: Nervous system and blood flow | The nervous system quickly adjusts blood flow by directly controlling:
a. blood viscosity b. vessel radius c. vessel length d. none of these |
| Quantitative literacy: Protein synthesis | If we have an mRNA sequence with 30 nucleotides, how many amino acids would be found in the resulting polypeptide (protein) chain?
a. 10. b. 30. c. 60. d. 90. |
Blood osmolarity and volume | Increased blood osmolarity (concentration of solutes) would lead to:
a. decreased blood volume b. increased blood volume c. no change in blood volume
|
| Muscle physiology: Sarcomeres and sliding filament theory | What happens to sarcomeres when actin and myosin filaments in a muscle fiber interact during the contraction phase?
a. sarcomeres usually fatigue b. sarcomeres usually get shorter c. sarcomeres usually get longer d. sarcomeres stay the same size |
Respiration: Gas exchange; diaphragm; volume and pressure relationships | When the diaphragm contracts during inspiration:
a. the lung volume decreases causing the air pressure in alveoli to increase b. the lung volume increases causing the air pressure in alveoli to decrease c. the lung volume decreases causing the air pressure in alveoli to decrease d. The lung volume increases causing the air pressure in alveoli to increase- |
| Muscle tension: Isometric and isotonic contraction | When a muscle develops increased tension, but does not shorten, it is said to exhibit:
a. treppe b. fatigue c. isometric contraction d. isotonic contraction |
Acid base balance: Kidneys role in acid base balance | What would happen if the kidneys no longer secreted/removed H+ and no other acid-base balance compensating mechanisms occurred?
a. blood pH would rise b. blood pH would fall c. blood pH would be unchanged d. blood pH would either rise or fall or remain unchanged |
| Action potential: Speed | Action potentials move along different axons at different speeds. The slowest speed of conduction will be found in:
a. large unmyelinated axons b. small unmyelinated axons c. large myelinated axons d. small myelinated axons |
Digestion: Role of accessory glands in digestion; macromolecules | If the pancreas were severely damaged, digestion of which of the following would be affected?
a. carbohydrates b. proteins c. lipids d. all of these |
| Endocrine system: Hormone targets | What is the target organ of corticotropin releasing hormone (CRH)?
a. the anterior pituitary b. the posterior pituitary c. thyroid gland d. hypothalamus |
Reproduction: Male and female reproductive hormones: corpus luteum etc. | Which of the following hormones stimulates both development of the corpus luteum in females and production of testosterone in males?
a. FSH b. LH c. Progesterone d. Estrogen |
Students Struggling With Blood Osmolarity, Acid Base and Reproductive Hormone Topics, among Other Difficult Concepts in A&P II
In A&P II, the most difficult concepts that were consistently below the 50% benchmark were blood osmolarity, acid base and reproductive hormone type questions as shown in Figure 5 below (also see Table 3 for the relevant question to better understand level of difficulty). Similar to trends observed for ATP production, for action potential and QL Protein synthesis concepts in A&P I that were also below 50% performance, editing/clarifying the relevant questions didn’t result in much change over the years. Other topics that were consistently below the 70% benchmark were heart related concepts, as well as blood flow, respiration, digestion and reproductive hormone type questions.
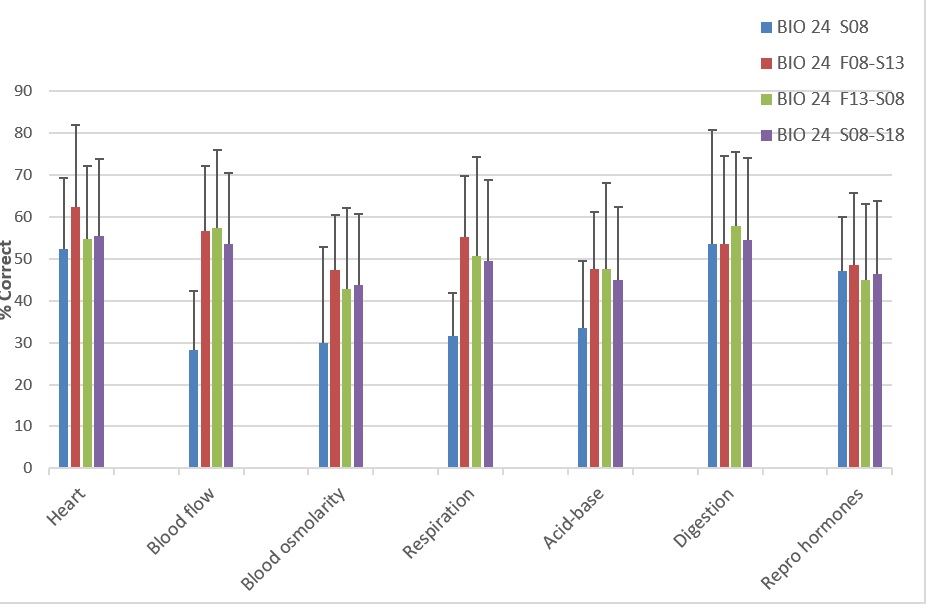
Figure 5: Most difficult BIO 24 (A&P II) concepts based on common exam analysis. The data shows comparison of the starting point at Spring 2008, the first and last five years, plus overall decade long averages along with standard deviation between sections (n=2674).
Interestingly, both digestion and reproductive concepts were covered towards the end of the semester, and it isn’t clear whether the below par performance is related to a truly difficult nature of the topics or semester timings. This is because these topics have always been covered at the end of the recommended syllabus schedule for the decade under study.
Discussion
This decade long study on summative assessment of A&P I and II cumulative common finals at our institution has revealed much useful data that will hopefully inform curricular changes in the coming years and decades, and continue with our already existing assessment culture (Abdullahi & Gannon 2015; Atamturktur, Khan & LaManna 2016). Most importantly, we have a better understanding of our non-traditional students and their struggles with the two semester A&P sequence. We should make every effort to consider better pedagogical strategies on how best to approach the most difficult concepts identified under this study. While we acknowledge the extrinsic motivation inherent in A&P students interest in pursuing allied health, we should always consider stimulating intrinsic motivation as well to better relate these difficult concepts (Kusurkar, Croiset, Ten Cate 2011). In advocating for this approach, Kusurkar and coworkers give twelve practical tips for health educators to try to get genuine interest out of their students for “autonomy, competence and relatedness.” Interventions to help with the difficult concepts may be at the individual faculty level: spending more time and effort when covering those topics, and perhaps also emphasizing it during review sessions ahead of major tests, as well as at the departmental and college level.
Several instructors in our department have incorporated active learning approaches, including flipped classroom models and concept mapping, in their teaching strategy, and may be this is the way to go for some of these difficult concepts. The use of pre-class reading assignments, videos and online software that allows students to generate multiple choice questions and test themselves has been shown to improve performance in biology courses (McQueen, Shields, Finnegan, Higham, & Simmen 2014; Lieu, Wong, Aseflrad, & Shaffer 2017). Our data also revealed high standard deviation ranging from 5-34% between sections, suggesting a large variation in student performance based on the sections they were in. While the influence of inherent diverse student academic abilities cannot be entirely discounted, it is possible that some of the faculty utilizing such active learning strategies have better student performances, thus contributing to the significant variations observed. Although we don’t have PeerWise-like student friendly software for online testing assessment, which has been reported to be very beneficial (McQueen et al. 2014), our colleague, Maureen Gannon, has recently developed an online test pool resource for A&P that may help students better master some of these difficult concepts. Further, such a resource may be used for review sessions and/or as a compliment to already existing departmental databases. Regardless of the approach we take to help improve student outcomes, the efforts should be applauded.
When student struggles in the basic overview and chemistry topics covered at the beginning of the semester were noted in the past, a Pre-A&P work shop was initiated and has had some success at calming student anxiety and improving their confidence and performance (Abdullahi & Gannon 2012). This workshop has since been converted into an open access Pre-A&P online component (Liachovitzky 2015) that students may use as a relevant resource. The usefulness of such locally developed tools was felt elsewhere, with faculty from a community college in South Carolina contacting us for more details on the Pre-A&P workshop, allowing us to share our experiences and the link to this now online resource. Based on the current study, an online student resource tool on these most difficult concepts may also be included in a future Pre-A&P course component or as a stand-alone resource. Any effort to help build the foundation on basic biological concepts for our less-prepared nontraditional students and help improve their motivation and/or confidence will go a long way in improving student outcomes in Anatomy and Physiology (Sturges et al. 2016; Harris, Hannun & Gupta, 2004).
The study also revealed the importance of faculty cooperation in executing the assessment process (Sujitparapitaya 2014). A decade of assessment is a long time, which may result in faculty fatigue, but over the years we have had over three quarters of faculty send their data to course coordinators each semester. Improvements in faculty participation were observed when reminders were sent, and more so when the process was simplified with a google doc data collection strategy. However, the introduction of google doc in the later years of the study resulted in a slight drop in student performance, suggesting we may have had a slightly different profile of faculty participants. It is possible some faculty who weren’t comfortable with technology may have shied away from asking for help and instead chose not to contribute, while also making it easier for others who did not previously contribute to do so.
In addition to faculty involvement, another key component that may have contributed to the longevity of the study is administrative support, with regular assessment discussion at course, departmental and college-wide forums. Our college has even introduced a classroom assessment project as a key component of the New Faculty seminar, and there are multiple opportunities to present assessment data locally. Since we now know some of the most challenging topics for our students and perhaps have an idea how our students respond to our different teaching approaches, faculty and administrators alike should consider innovative curricular changes to help improve on student outcomes in the difficult concepts. For instance, when a few faculty colleagues obtained a Perkins grant to introduce quantitative literacy into the curriculum, there appeared to be a visible improvement on the QL-related question on protein synthesis (notice the higher performance in the first 5 years). This implies that the increased time spent on quantitative exercises during the grant-supported intervention initiative improved performance. Perhaps the department should support more study lab tutorials and weekend review sessions, with a new focus on these difficult concepts.
Although we have had several meetings over the years, constantly modifying existing common exam questions especially those on difficult concepts that students struggle with, this seems to have had little impact on student performance. Once we obtained data for the first few years, Pearson correlation statistics could accurately predict the rest of it, meaning if there were any improvements it was either masked by the high standard deviation or may only account for a relatively small percentage that couldn’t significantly alter the entire data set. When modifying questions, we maintained the same concepts, but changed the wordings for clarity. The most notable success in this area was when we were able to dramatically improve on the performance in an A&P II question on blood pressure/graph interpretation (data not shown). In that case, to answer the question correctly, students were first expected to know that the vessel that returns blood from the kidney “was a vein” and identify the relevant blood pressure readings for “a vein” in a graph with multiple blood vessels (arteries, veins and capillaries). When assessment data revealed that students were struggling with this simple concept, it wasn’t clear whether students couldn’t interpret the graph or didn’t know the relevant blood vessel that “returns blood from the kidneys.” When we made it obvious that we were referring to a vein and all they had to do was interpret the graph, there was a huge improvement, with performance way over the 70% benchmark. However, we didn’t have as much success with the other A&P concepts that students struggled with over the semesters.
Interestingly, when the recommended syllabus schedule was switched around midway through the study, performance on muscle and endocrine system concepts switched as well, with an almost mirror image type relationship observed, as shown in Figure 4. Similarly, performance on digestion and reproductive concepts covered towards the end of A&P II were generally well below the 70% benchmark. This data is the clearest indication that the timing of syllabus coverage may have a huge impact on student performance, potentially because some faculty may not get to that topic or may rush through it towards the end of the semester. However, this could also suggest students may be overwhelmed at the end of the semester and may not be paying as much attention then. There is evidence that students often overestimate their expected grades at the beginning of the semester and are thus more likely to be motivated to grasp the information (Sturges et al. 2016). However, after receiving feedback throughout the semester, reality hits for weaker students that habitually inflate their expectations earlier in the semester and they are less likely to have similar motivations towards the end of the semester. They may lose confidence in their abilities and pay less attention in classroom discussions and misunderstand course content (Jensen & Moore 2008; Sturges et al. 2016). It’s during these last few weeks of the semester when some of the weaker students generally disappear, only to reappear during finals week or never appear again (personal observations).
It’s worth noting that even though we focused mostly on the 7 most difficult concepts identified for each of the two semester A&P courses and the role of semester timings in performance, we were able to achieve or be very close to the benchmark for 68% of concepts tested in A&P I (17 out of 25 questions) and 52% for A&P II concepts (13 out of 25 questions). The results for A&P I are more impressive and are in line with our previous pre- and post-test data that showed our student population was able to master about 70% of basic concepts tested (7 out of 10 concepts tested then; Abdullahi & Gannon 2015). The results for A&P II wasn’t as impressive, with an almost fifty-fifty scenario for those at or approaching the benchmark versus the rest of the concepts examined. It is important to understand that this does not necessarily mean a drop in performance from A&P I to II at similar levels; it may also reflect the fact that the questions for A&P II were relatively more advanced application type questions per Blooms taxonomy (Bloom 1974). The rationale for this was that more advanced students (even though by just a semester sometimes) were more likely to handle more advanced questions than those for gateway courses like A&P I. When we compared performance for low level and high level questions for related A&P concepts in our previous study involving this student population, the result was similar in that students had a difficult time applying the low level concept mastered to a higher level question in over half of the 10 concepts tested (Abdullahi & Gannon 2015).
In summary, our decade long study has revealed that our students struggle with some difficult concepts, where performance is way below the 70% benchmark, with student performance even below 50% in some of these concepts. We should all attempt to come up with ways to use the data positively to improve student outcomes. We know that better student preparation, fewer outside working hours, lower semester course load, and improved intrinsic motivation have been positively correlated with student success (Sturges et al. 2016; Harris, Hannun & Gupta, 2004), and we should advise students in these areas, but concentrate our efforts in areas that we have more control over. For instance, we should prioritize flipped classroom model and other active learning strategies that could help improve performance on the most difficult concepts identified. We should also encourage more formative assessment strategies and other appropriate interventions to help more students achieve their dreams and contribute to improving student mobility rates, with stable and secure future careers.
References
Abdullahi, A.S. (2011). Student Exam Participation and Performances in a Web-Enhanced Traditional and Hybrid Allied Health Biology Course. Journal of Online Learning and Teaching. 7(4):426-438. Available online at http://jolt.merlot.org/vol7no4/abdullahi_1211.pdf
Abdullahi, A.S & Gannon, M.N. (2012). Improving college students’ success in gateway science courses: lessons learned from an anatomy and physiology workshop. American Journal of Health Sciences, 3(3):159-168.
Abdullahi, A.S. & Gannon, M. (2015). Assessment of Student Learning and Retention of Chemical and Cellular Concepts in Human Anatomy and Physiology. In vivo 36(3):109-122.
Atamturktur, S., Khan, S., & LaManna, R. (2016). The Growth of an Assessment Culture in a Biology Department. In vivo 37(3):101-114.
Bloom, B. S. (1974). An introduction to mastery learning theory. In J. H. Block (Ed.), Schools, society, and mastery learning. New York: Holt, Rinehart and Winston.
Chronical of Higher Education. Colleges with the highest student-mobility rates. (2017). https://www.chronicle.com/article/Colleges-With-the-Highest/241450
Dean, J.H., & Fischer, S. E. (1992). Nursing predictors study, phase one. Educational Resources Information Center (ERIC), EDRS # 349-036.
HAPS comprehensive exam. Available online at http://www.hapsweb.org/?page=ComprehensiveExam
Harris, D.E., Hannun, L., & Gupta, S. (2004). Contributing factors to student success in Anatomy and Physiology: Lower outside workload and better preparation. American Biology Teacher, 66(3), 168-175. Retrieved from http://www.jstor.org/discover/10.2307/4451650?uid=3739832&uid=2129&uid=2&uid=70&uid=4&uid=3739256&sid=21102312993667
Hull, K., Wilson, S., Hopp, R., Schaefer, A., & Jackson, J. (2016). Determinants of Student Success in Anatomy and Physiology: Do Prerequisite Courses Matter? A Task Force Review. HAPS Educator. 20(2): 38-45. https://www.researchgate.net/publication/301540266_Determinants_of_Student_Success_in_Anatomy_and_Physiology_Do_Prerequisite_Courses_Matter
Jensen, P.A., & Moore, R. (2008). Students’ Behaviors, Grades & Perceptions in an Introductory Biology Course. American Biology Teacher, 70(8), 483-487. https://doi.org/10.1662/0002-7685(2008)70[483:SBGPIA]2.0.CO;2
Kusurkar, R.A., Croiset, G., & Ten Cate, T.J. (2011). Twelve tips to stimulate intrinsic motivation in students through autonomy-supportive classroom teaching derived from self-determination theory. Med Teach 33: 978–982.
Liachovitzky, Carlos, “Human Anatomy and Physiology Preparatory Course” (2015). CUNY Academic Works. https://academicworks.cuny.edu/bx_oers/1
Lieu, R., Wong, A., Aseflrad, A., & Shaffer, J.F. (2017). Improving Exam Performance in Introductory Biology through the Use of Preclass Reading Guides. CBE—Life Sciences Education.16(3), 1–10.
McKee, G. (2002). Why is biological science difficult for the first-year nursing students? Nurse Ed. Today, 22, 251-257. Retrieved from http://www.ncbi.nlm.nih.gov/pubmed/12027607
McQueen H.A., Shields C., Finnegan D.J., Higham J., Simmen M.W. (2014). PeerWise provides significant academic benefits to biological science students across diverse learning tasks, but with minimal instructor intervention. Biochemistry and Molecular Biology Education. 42:371–381. [PubMed] [Google Scholar]
Neuman, L.H. (1991). The relationship between admission/academic achievement variables and pass/fail performance on the National Council Licensure Examination for Registered Nurses (NCLEX-RN) in an LPN-RN program. Ph.D. diss., University of Maryland, College Park.
Sturges, D., Maurer, T.W., Allen, D., Gatch, D.B., & Shankar, P. (2016). Academic performance in human anatomy and physiology classes: a 2-yr study of academic motivation and grade expectation. Adv Physiol Educ40: 26–31. https://doi.org/10.1152/advan.00091.2015
Sujitparapitaya, S. (2014). Achieving faculty buy-in: Motivation performance in learning outcome assessment. Journal of Case Studies in Accreditation and Assessment, 3, 1-22.
Szpunar, K.K., McDermott, K.B., & Roediger III, H.L. (2007). Expectation of a final cumulative test enhances long-term retention. Memory & Cognition 2007, 35 (5), 1007-1013.
Trackback from your site.